Archive for the ‘Heatmaps’ tag
C# & Science: A 2D Heatmap Visualization Function (PNG)
Today, let’s take advantage of the bitmap writing ability of C# and output some heatmaps. Heatmaps are a nice visualization tool as they allow you to summarize numeric continuous values as colour intensities or hue spectra. It’s far easier for the human to grasp a general trend in data via a 2D image than it is to interpret a giant rectangular matrix of numbers. I’ll use two examples to demonstrate my heatmap code. The function provided is generalizable to all 2D arrays of doubles so I welcome you to download it and try it yourself.
>>> Attached: ( tgz | zip — C# source: demo main, example data used below, makefile ) <<<
Let’s start by specifying the two target colour schemes.
- RGB-faux-colour {blue = cold, green = medium, red = hot} for web display
- greyscale {white = cold, black = hot} suitable for print
Next, let’s take a look at the two examples.
Example Heat Maps 1: Bioinformatics Sequence Alignments — Backtrace Matrix
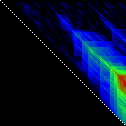
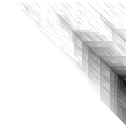
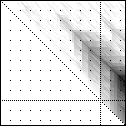
Here’s an application of heat maps to sequence alignments. We’ve visualized the alignment traces in the dynamic programming score matrices of local alignments. Here, a pair of tryptophan-aspartate-40 protein sequences are aligned so that you can quickly pick out two prominent traces with your eyes. The highest scoring spot is in red — the highest scoring trace carries backward and upward on a diagonal from that spot.


The left heatmap is shown in RGB-faux-colour decorated with a white diagonal. The center heatmap is shown in greyscale with no decorations. The right heatmap is decorated with a major diagonal, borders, lines every 100 values and ticks every ten values. Values correspond to amino acid positions where the top left is (0, 0) of the alignment.
Example Heat Maps 2: Feed Forward Back Propagation Network — Weight Training
Here’s another application of heat maps. This time we’ve visualized the training of neural network weight values. The weights are trained over 200 epochs to their final values. This visualization allows us to see the movement of weights from pseudorandom noise (top) to their final values (bottom).


Shown above are the weight and bias values for a 2-input, 4-hidden-node, 4-hidden-node, 2-output back-propagation feed-forward ANN trained on the toy XOR-EQ problem. The maps are rendered as RGB-faux-colour (left); greyscale (center); and RGB-faux-colour decorated with horizontal lines every 25 values (=50px) (right). Without going into detail, the leftmost 12 columns bridge inputs to the first hidden layer, the next 20 columns belong to the next weight layer, and the last 10 columns bridge to the output layer.
Update: I changed the height of the images of this example to half their original height — the horizontal lines now occur every 25 values (=25px).
C# Functions
This code makes use of two C# features — (1) function delegates and (2) optional arguments. If you also crack open the main file attached, you’ll notice I also make use of a third feature — (3) named arguments. A function delegate is used so that we can define and select which heat function to use to transform a three-tuple of double values (real, min, max) into a three-tuple of byte values (R, G, B). Optional arguments are used because the function signature has a total of twelve arguments. Leaving some out with sensible default values makes a lot of sense. Finally, I use named arguments in the main function because they allow me to (1) specify my optional arguments in a logical order and (2) read which arguments have been assigned without looking at the function signature.
Heat Functions
For this code to work, heat functions must match this delegate signature. Arguments: val is the current value, min is the lowest value in the matrix and max is the highest value in the matrix; we use min and max for normalization of val.
public delegate byte[] ValueToPixel(double val, double min, double max);
This is the RGB-faux-colour function that breaks apart the domain of heats and assigns it some amount of blue, green and red.
public static byte[] FauxColourRGB(double val, double min, double max) {
    byte r = 0;
    byte g = 0;
    byte b = 0;
    val = (val - min) / (max - min);
           if(               val <= 0.2) {
        b = (byte)((val / 0.2) * 255);
    } else if(val >  0.2 &&  val <= 0.7) {
        b = (byte)((1.0 - ((val - 0.2) / 0.5)) * 255);
    }
           if(val >= 0.2 &&  val <= 0.6) {
        g = (byte)(((val - 0.2) / 0.4) * 255);
    } else if(val >  0.6 &&  val <= 0.9) {
        g = (byte)((1.0 - ((val - 0.6) / 0.3)) * 255);
    }
           if(val >= 0.5               ) {
        r = (byte)(((val - 0.5) / 0.5) * 255);
    }
    return new byte[]{r, g, b};
}
This is a far simpler greyscale function.
public static byte[] Greyscale(double val, double min, double max) {
    byte y = 0;
    val = (val - min) / (max - min);
    y = (byte)((1.0 - val) * 255);
    return new byte[]{y, y, y};
}
Heatmap Writer
The function below is split into a few logical parts: (1) we get the minimum and maximum heat values to normalize intensities against; (2) we set the pixels to the colours we want; (3) we add the decorations (borders, ticks etc.); (4) we save the file.
public static void SaveHeatmap(
    string fileName, double[,] matrix, ValueToPixel vtp,
    int pixw = 1, int pixh = 1,
    Color? decorationColour = null,
    bool drawBorder = false, bool drawDiag = false,
    int hLines = 0, int vLines = 0, int hTicks = 0, int vTicks = 0)
{
    var rows = matrix.GetLength(0);
    var cols = matrix.GetLength(1);
    var bitmap = new Bitmap(rows * pixw, cols * pixh);

    //Get min and max values ...
    var min = Double.PositiveInfinity;
    var max = Double.NegativeInfinity;
    for(int i = 0; i < matrix.GetLength(0); i ++) {
        for(int j = 0; j < matrix.GetLength(1); j ++) {
            max = matrix[i,j] > max? matrix[i,j]: max;
            min = matrix[i,j] < min? matrix[i,j]: min;
        }
    }
    //Set pixels ...
    for(int j = 0; j < bitmap.Height; j ++) {
        for(int i = 0; i < bitmap.Width; i ++) {
            var triplet = vtp(matrix[i / pixw, j / pixh], min, max);
            var color = Color.FromArgb(triplet[0], triplet[1], triplet[2]);
            bitmap.SetPixel(i, j, color);
        }
    }
    //Decorations ...
    var dc = decorationColour ?? Color.Black;
    for(int i = 0; i < bitmap.Height; i ++) {
        for(int j = 0; j < bitmap.Width; j ++) {
            if(drawBorder) {
                if(i == 0 || i == bitmap.Height -1) {
                    // Top and Bottom Borders ...
                    bitmap.SetPixel(j, i, dc);
                } else if(j == 0 || j == bitmap.Width -1) {
                    // Left and Right Borders ...
                    bitmap.SetPixel(j, i, dc);
                }
            }
            if(bitmap.Width == bitmap.Height && drawDiag && (i % 2 == 0)) {
                // Major Diagonal ... (only draw if square image +explicit)
                bitmap.SetPixel(i, i, dc);
            }
            //Zeroed lines and zeroed ticks are turned off.
            if(hLines != 0 && i % (hLines*pixh) == 0) {
                if(j % (2*pixw) == 0) {
                    //Horizontal Bars ...
                    bitmap.SetPixel(j, i, dc);
                }
            } else if(hTicks != 0 && i % (hTicks*pixh) == 0) {
                // Dots: H-Spacing
                if(vTicks != 0 && j % (vTicks*pixw) == 0) {
                    // Dots: V-Spacing
                    bitmap.SetPixel(j, i, dc);
                }
            } else if(i % (2*pixh) == 0) {
                if(vLines != 0 && j % (vLines*pixw) == 0) {
                    //Vertical Bars
                    bitmap.SetPixel(j, i, dc);
                }
            }
        }
    }

    //Save file...
    bitmap.Save(fileName, ImageFormat.Png);
    bitmap.Dispose();
}
Happy mapping 😀
Compatibility Notes: The C# code discussed was developed with Mono using Monodevelop. All code is compatible with the C#.NET 4.0 specification and is forward compatible. I’ve linked in two assemblies — (1) -r:System.Core for general C#.Net 3.5~4.0 features, and (2) r:System.Drawing to write out PNG files. If you need an overview of how to set up Monodevelop to use the System.Drawing assembly, see C Sharp PNG Bitmap Writing with System.Drawing in my notebook.
 Ed's Big Plans